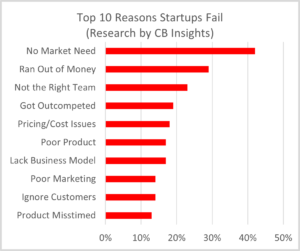
Nearly every young startup has product/market fit on its mind, if not explicitly then implicitly. Why?
Because you can only start scaling after you find customers who get value from your product through regular use. Lack of market need kills startups above all else.
But ‘lack of market need,’ in actuality, often means an entrepreneur isn’t aware of how to attract key customers. It doesn’t necessarily mean there aren’t enough key customers.

If you are struggling to connect with your ideal customers, do some market research to turn things around!
If not enough customers are coming to you, sales & marketing research gives you new ways to come to them. There are many measures of PMF; we summarize a few here. We also add ways you can increase product/market fit through research.
Supercharge it!
Emotional Investment
Measure customers’ emotional investment in your offering through a survey.
On a scale of 1 to 6, ask: “How would you feel if you could no longer use our [product/service]?”
(6) Very disappointed
(5) Somewhat disappointed
(4) Neutral
(3) A bit disappointed
(2) Not disappointed at all
(1) I no longer use [product/service]
Supercharge your product-market fit! Briefly interview customers who marked that they’d feel ‘very disappointed’ if they could no longer use your product.
Note down what they say in their own words. Analyze the general themes that emerge on reasons why they love your product. Use these customers own’ words to describe your product in sales conversations and marketing efforts.
The emotional draw for prospective customers will be strong.
Usage Frequency
Review your records or do a survey to find out how often customers use your offering – daily, weekly, or monthly.
Choose a frequency well-fit to your product/service. For example, if you are a restaurant delivery app, measure usage week by week, since customers aren’t as likely to order daily or monthly.
Supercharge your product-market fit! Ask regular users about what keeps them coming back often for your product.
Create personas by analyzing frequent product usage in relation to age cohort (Gen Z, Millennial, etc.), job role (CEO, product manager, etc.), values (conservative, liberal), and preferred social media channels.
These are your best customers, so use this data to craft marketing materials, and hit media channels that will attract more of them!

Customer Retention
Take a group of customers who started using your offering around the same time, and measure the percentage who are still using it long-term.
The ideal group/cohort retention rate depends on your industry. For example, a 25% retention rate may be healthy in the mobile app industry, while for SaaS it may be 70%.

Supercharge your product-market fit! Get to know your most loyal customers. Find out exactly what they are drawn to in your products and company.
For a deeper connection, survey their demographics, interests, hobbies, values, and the media channels they use. Slice and dice to create markets to target. Utilize this valuable info about your loyal customers, to create a powerful marketing plan.
Customer Referrals
The spread of word of mouth is a great indicator of product/market fit.
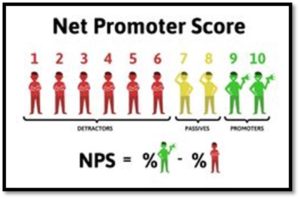
The Net Promoter Score (NPS) is a question to measure the chances of referral on a scale of 1 to 10: “How likely would you be to recommend [product/service] to a friend or colleague?” Supercharge your product-market fit! Run a survey, and analyze the customers who rate you a ‘9’ or ’10.’
These 9s and 10s are your Product Promoters.
What features or bundle do they tend to use? What would they share with others about your startup? Discover your Promoters’ target details. What price range are they located in? Industries? Personality? Lifestyle? Location? What marketing channels do they use?
Target these golden nuggets of customer detail in your marketing plan or in sales conversations with prospects.

Customer Dissatisfaction
If you tend to keep customers, you’re doing a good job of meeting their needs; a sign of product/market fit.
But if many are churning, you are at risk of going out of business, because although your customers may be growing, you could still be losing a large percentage of them every month.
Generally, your retention rate should be at least 85%, but also consider that retention depends on the industry.
How to calculate customer churn: the number of existing customers who left during [the month, quarter, or year] divided by the total customers at the start of that period.

Supercharge your PMF! Survey customers to find out why they churn, to apply the right fixes.
You may be attracting the wrong customer, they are frustrated by certain key features, they aren’t getting the support they need, you’re too expensive, and the list goes on. Find out if certain customer groups are more likely to churn (e.g. B2B by industry, job role, price point, etc. B2C by values, interests, price point, etc.).
In Closing
Has product-market fit been a challenge for you? Have you got all the tools you need to find out how you’re doing with your startup’s product-market fit?
If you’re struggling to find the product-market fit you want, you can research your customers, and apply their insights to your sales and marketing process.
At Truify.co, we are here every step of the way. We can do all your research, aspects of it you don’t want to, or we can offer consultative advice.
We’d love to connect with you. Book a discovery Zoom where we can learn about your business questions at calendly.com/arie-10/30min


Hi, this is a comment.
To get started with moderating, editing, and deleting comments, please visit the Comments screen in the dashboard.
Commenter avatars come from Gravatar.